Our 2017 Email Marketing Metrics Report
How do your email metrics stack up? We share insight into our 2017 email campaigns, findings and strategy for 2018.
Email marketing is a vital communications channel, yet with the nature of email constantly changing, email marketing strategists must be mindful of their customer’s concerns and needs to keep this channel thriving.
As a provider of email marketing services, we often wonder how we stack up compared to other digital and creative agencies in the industry. We thought we’d compile our findings from our email marketing for all of 2017 into our 2017 Email Marketing Metrics Report, which outlines our key findings from 2017 and how it will inform our email marketing strategy for 2018.
Missing out on our news? Sign up here.
Australia’s 2017 email statistics at a glance
- 28% open email in a web browser, 50% on mobile and 22% on desktop
- 40% of Australians use Gmail to check emails
- 57% of email subscribers spend 10-60 minutes browsing marketing emails every week
- Call-to-actions are 47% higher for B2B email campaigns than B2C campaigns
- 320% more revenue is attributed to welcome emails
- SMBs in 2017 reported that an extra 25% intend to be promoting the business via email marketing (currently 25%).
- 95% of SMBs used the internet for email
- But only 25% use email marketing to promote their business
- 23% of SMBs use the internet to promote the business using email marketing
- 16% of ecommerce SMBs use the internet for promoting the business using email marketing.
Our email marketing: The basics
Average List Size 3,400+ Contacts
Send schedule Average 1 X per month
Automation Welcome email
Provider Vision6
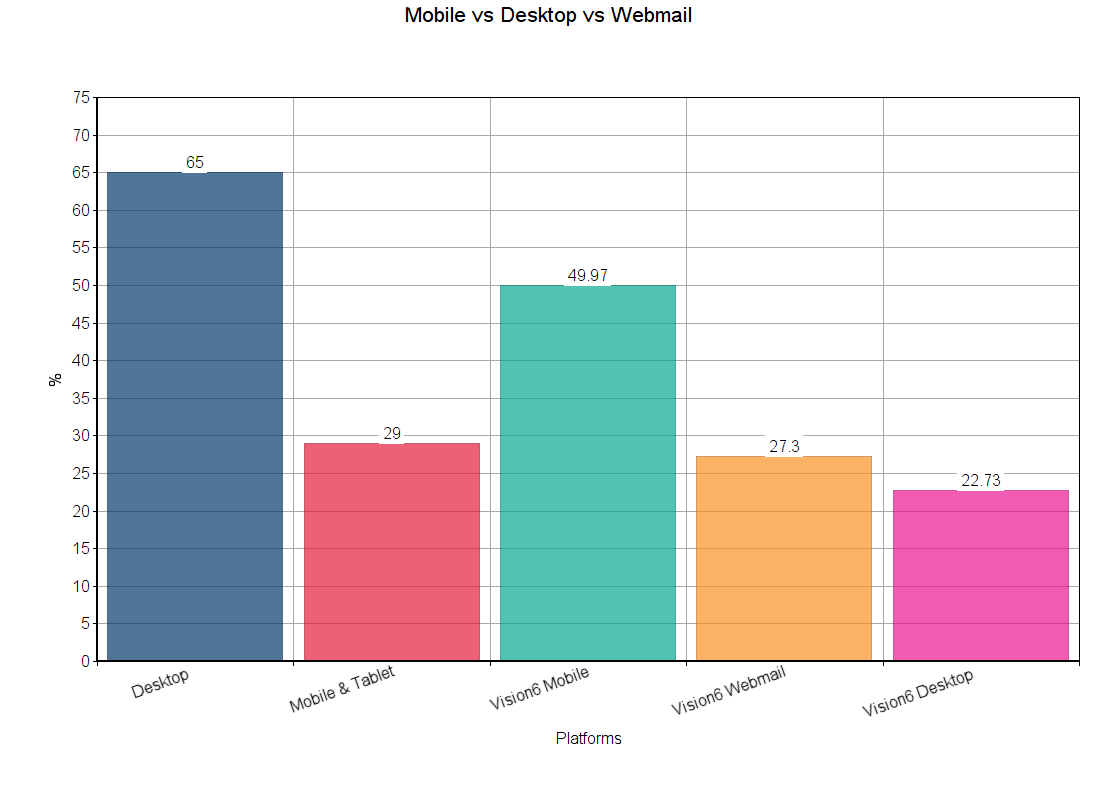
Mobile vs Desktop vs Webmail
This chart shows the average popularity of the different platforms our readers use to open the iFactory email marketing campaigns in 2017 and Vision6’s benchmark.
Our findings
In most industries, particularly fashion and retail, mobile will always reign king. But we found the opposite with our user base. From our customer research, this is mostly because much of our audience is using a work-related email address and engaging with our email campaigns during office hours. This data informs much of our email strategy, particularly when designing templates and determining send time.
Over the last five years, Vision6 has seen mobile opens increase from a mere 10%.
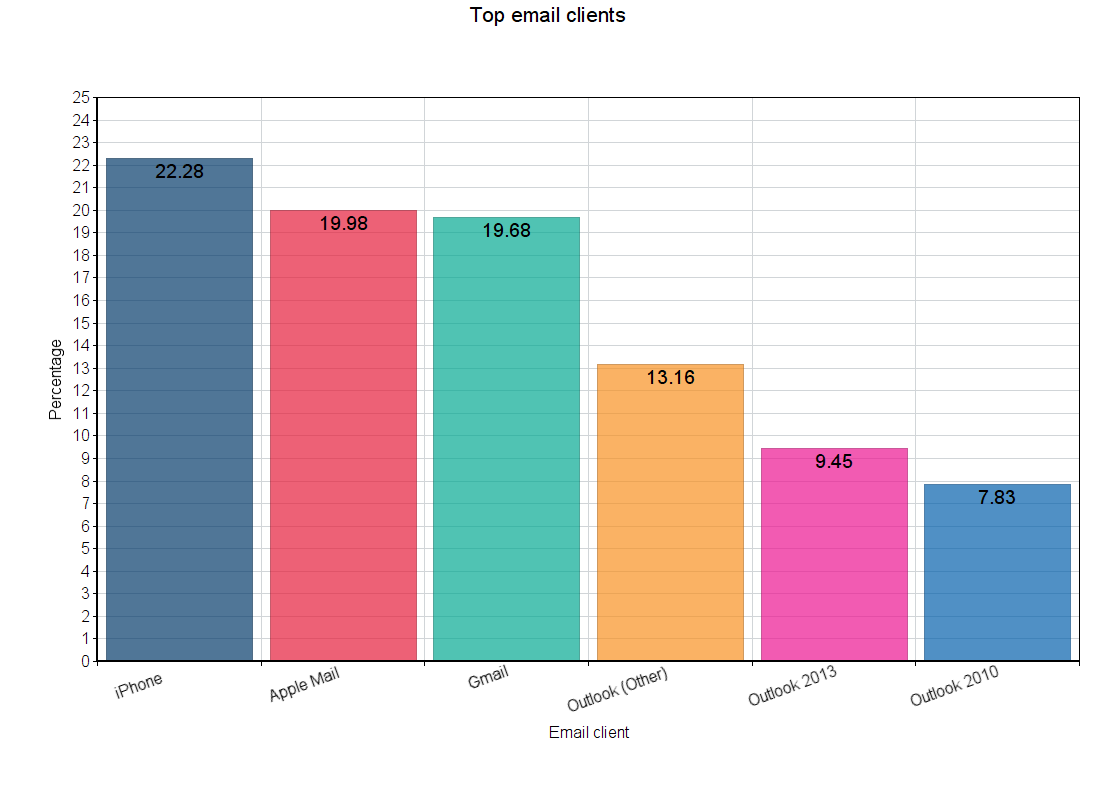
Top email clients
This list shows the top email clients our subscribers use in a desktop and webmail environment.
Our findings
Our audience is mostly using an iPhone, closely followed by Apple Mail. As many email marketers know, what a design looks like in Gmail won’t always translate across Apple Mail or Outlook. This could be anything from colours not displaying correctly to new design technologies that aren’t visible or compatible with the email agent. Understanding where our readers are viewing us helps us when testing design components. We use email testing programs such as Litmus, which is an email design and testing tool, to help optimise and fine-tune for best performance.
Vision6 found across their results for 2017 across all sectors, that over the years desktop clients have decreased in popularity and they have seen a rise in webmail clients being used. The increasing prevalence of businesses moving their email applications into the cloud has influenced this, with recent years both Gmail and Apple Mail taking out the top 2 positions of email clients.
Open Rates
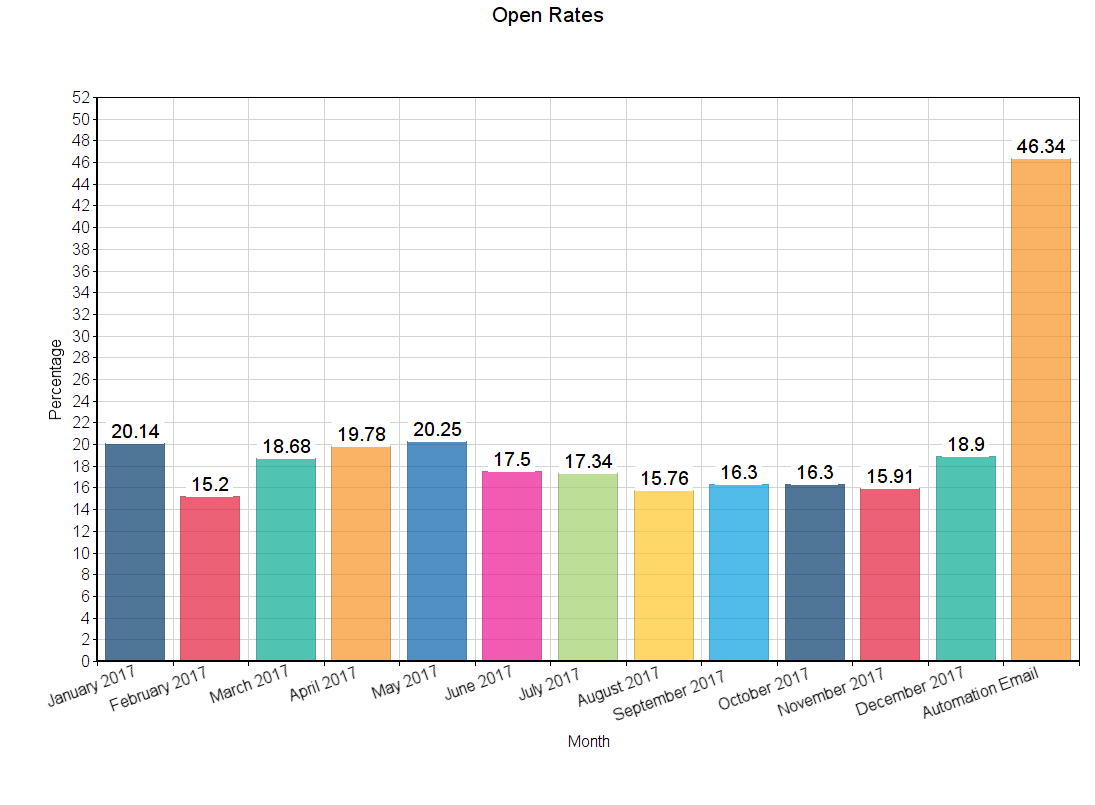
This chart looks at all our open rates for each email campaign sent in 2017.
As we may send more than one email campaign a month (newsletter, announcements etc) this is the average open rate for the month.
Findings
According to Smart Insights, small-to-medium marketing and creative service agencies in Australia average 18.2% open rates. Our overall average for the year was 19.88%. While our open-rates fall within the range of the industry average, our 2018 email strategy will involve actively pursuing higher engagement rates through smart copywriting and engaging visual content that people will notice, read and trust.
Through auditing, analysing and applying psychology techniques, we discovered that the most engaging email marketing subject lines for our industry focused on:
- Honing the reader’s digital literacy
- The competitiveness of professionals and the businesses in their sector
- Human interest pieces – particularly for social awareness campaigns
- Customer-centric wording that spoke directly to the reader
The least engaging subject lines for our industry included:
- Non-descriptive, long or vague subject headlines
- Topics that do not relate to the business or interests
Vision6 found in 2017 the average Open Rate has been steady for some time now and has been tracking in the 30s. Vision6 found the open rate benchmark for the IT, Marketing & Telecommunications industry was 30.63% (This sector is large and varied.)
Click-Through Rates
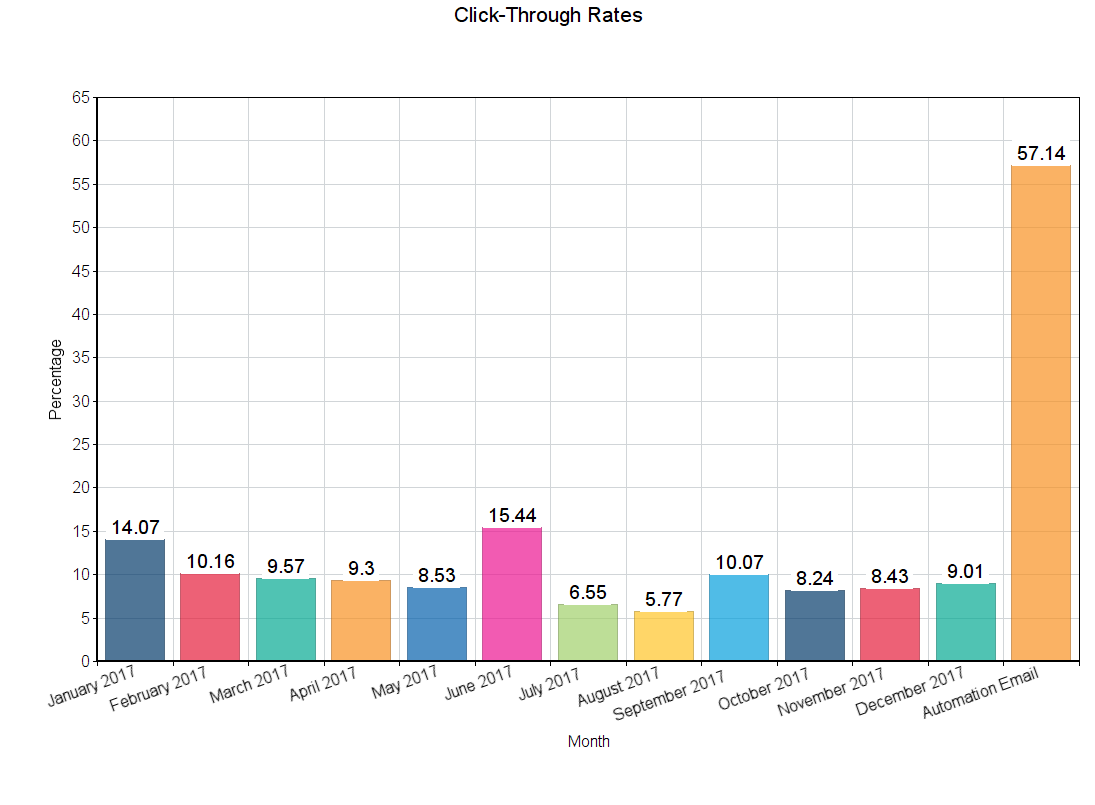
This chart shows our average click-through rate for email campaigns sent in 2017.
Findings
Our overall average for 2017, was 13.25%. The average click-through-rate for our industry (IT, Marketing & Telecommunications) is currently sitting at 4.5%, which means we are performing above industry standards. Vision6 found the overall average Click-Through-Rates (CTR) for 2017 have ranged between 4.5% and 6%. The best way to increase your email campaign click-through-rate is to ensure your content is highly relevant and interesting. We’ve spent the past year testing different types of call-to-actions, including text links, buttons and images to determine what grabs our reader’s attention. From click mapping technology and link tracking, we can see that our readers interact best with a combination of compelling in-text links and bold content titles.
Bounce rates
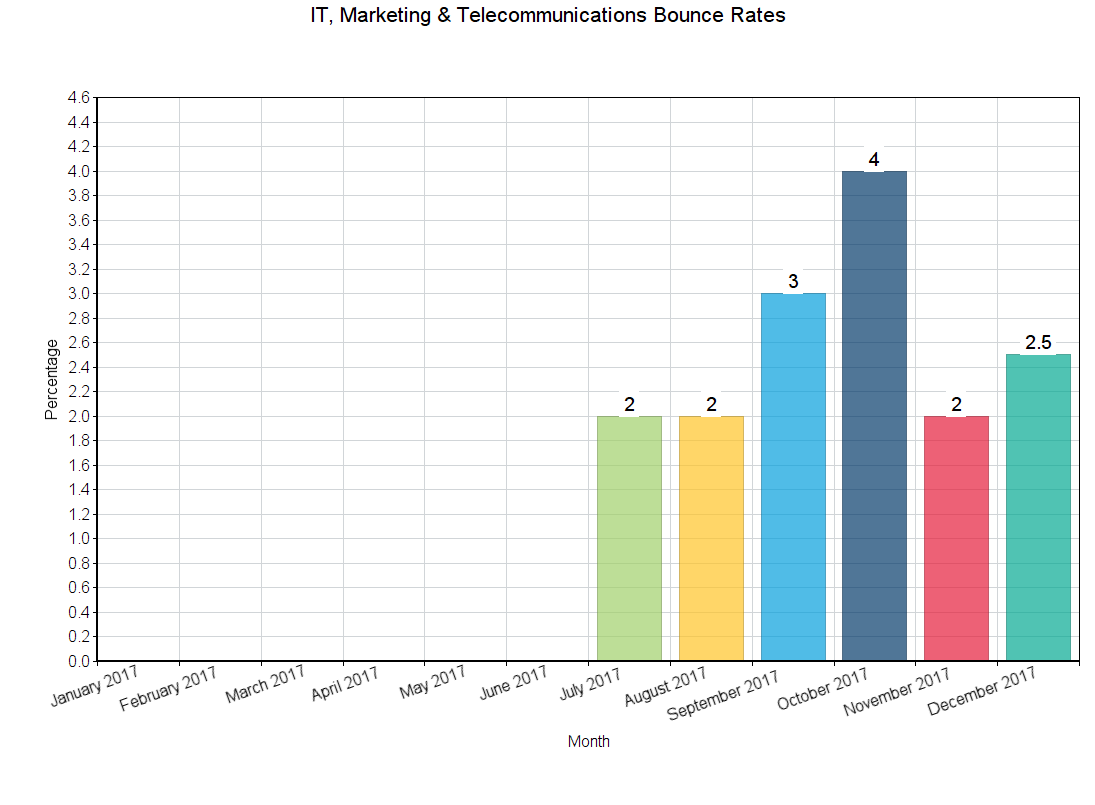
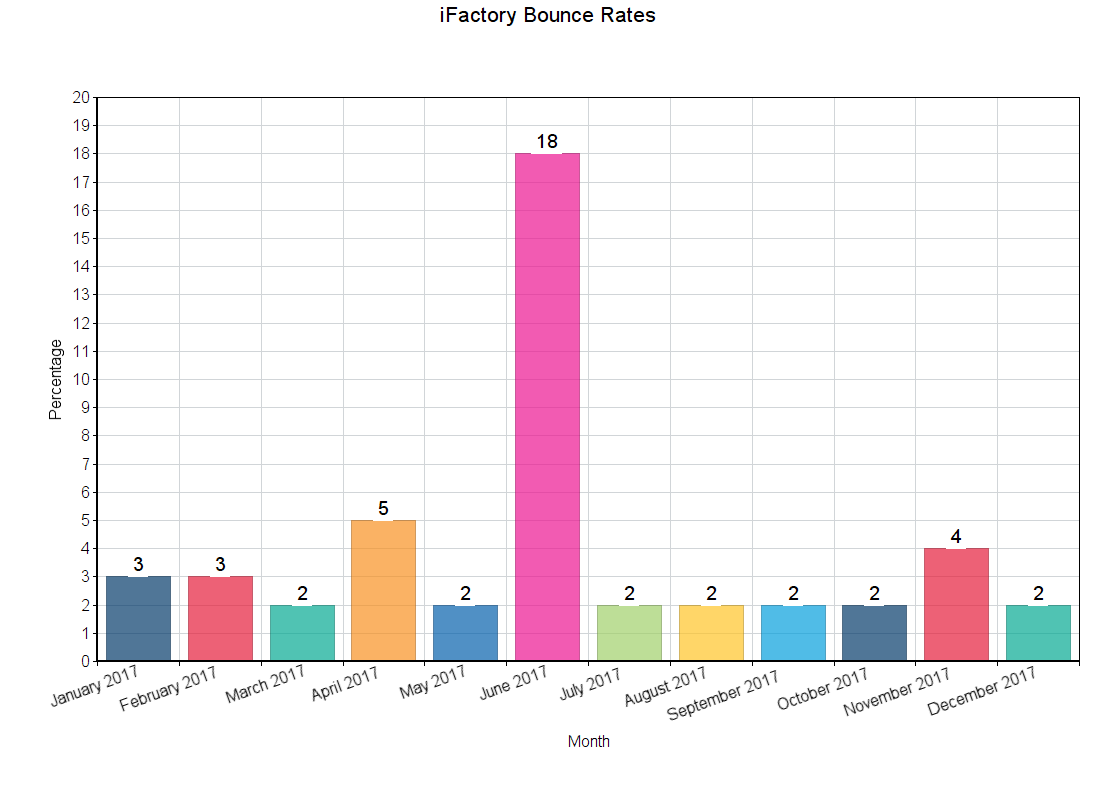
This chart looks at bounce rates for iFactory’s email campaigns for 2017, compared to the industry average for the IT, Marketing & Telecommunications industry from Vision6.
IT, Marketing & Telecommunications bounce rates
From January – June 2017 no data was provided.
iFactory bounce rates
Findings
Overall we had a bounce rate of 4%. You can see a big spike in bounce rates in June 2017, when we imported data from another CRM we had previously utilised which pushed up our overall bounce rate for the year. Email bounce rates have fallen dramatically across all industries over the past few years as email marketers and automation tools prioritise list hygiene. Starting with a good sign up form, regularly cleaning our lists, ensuring our emails don’t look like spam by using tools Litmus and sticking to a consistent mailing schedule are just a few of the ways we keep our bounce rates down. Bounce rates across all sectors are currently sitting around 2% and the IT, Marketing & Telecommunications sector at 2.6%.
Day and time to send
We spent 2017 reviewing the best day and time to send our email campaigns to finalise our sending schedule. We always sent our newsletters in week two of the month to ensure a schedule was adhered to.
Our best click-through rates were recorded when our email campaigns were sent at the following times:
- 2:30 pm
- 3:00 pm
- 10:30 am
- 10:00 am
Our best open rates were recorded when our email campaigns were sent on the following days:
- Wednesday
- Thursday
- Friday
Our best click-through rates were recorded when our email campaigns were sent on the following days:
- Wednesday
- Thursday
- Friday
Our findings
We found our sends on Wednesdays were the most successful, as they achieved the best open rate and click-through rate. Overall our most successful day and times to send were Wednesdays at 2:30 pm AEST.
According to most reports across all industries, Tuesdays result in the most emails opened compared to any other day of the week. HubSpot found that Tuesday is the best day to send email, followed by a tie for Monday and Wednesday. Weekdays (especially Tuesday to Thursday) at 8:00 am and 10:00 am have long been the best time to send email campaigns It’s been common knowledge throughout the industry that people tend to open their email in the mornings. Another notable time is 11:00 a.m. 8:00 p.m.-midnight as people are more likely to check their email before they go to bed at night.
Our top email content for 2017
These were the top clicked content pieces across all our campaigns in 2017.
- Case Study: Universal Cranes
- What is User Experience design all about?
- Revealed – Pantone’s colour of 2017
- A brief history of social media
- 2016 Sensis Social Media Report: Part One
- The top social media trends that will shape the year ahead
- Is it time to say goodbye to the fold for good?
- Have a successful social media account and have a life too
- Creatively solve problems using design thinking
- 5 features for a great website
Findings
Each content distribution platform will deliver different results. For email, our most popular content were case studies, thought-leadership and digital insight pieces, how-to guides and industry news. Interesting some of our most popular content was from January and September. We were clearly on fire then! Analysing our top performing content on each platform helps us understand who we’re talking to, the types of content they like to engage with on each channel and their pain points.
Our overall findings
We found that often we baulked the common industry standards, such as suggested best day to send or best time to send, desktop to mobile platforms.
As there are lots of sources out there telling you when is the best day and time to send an email campaign or should I send desktop-only email campaigns, the answer is: It depends on your own audience.
One can get into the trap is to think of “best day” and “best time of day” to send a campaign as two separate issues. The best time to send your campaign depends on the day you send it. And vice versa.
How can you know when to understand the best times to send email to your audience? We suggest you follow our lead and test!
- Send emails at the different times and days to learn what times and days’ work best for your audience.
- Analyse the data from your tests to see when you received the most traffic.
iFactory’s leading team of digital marketing professionals can transform your email campaigns and increase your customer engagement. To find out more about what we can do for you, contact us today.
Sources: Vision6, Sensis e-Business Report 2017: The Online Experience of Small and Medium Enterprises, Smart Insights
